Documents
LipidPedia is a comprehensive lipid knowledgebase. The content of this database derives from annotation data with full text mining of 408 lipids with over 40,000 annotations, covering associated diseases, pathways, functions, and locations that are essential to interpret lipid functions and mechanisms from more than 25,000 scientific literatures. Annotations are defined as concepts which are biomedical vocabularies and stands used in Unified Medical Language System (UMLS).
Each lipid in LipidPedia has its own record consisting of text summary organized by annotations. These annotations frequently appear in biomedical literature, including: diseases, pathways, genes, locations, functions, lipids and experimental models. As such, LipidPedia aims to provide an overall synopsis of lipids to summarize lipids annotations and the detailed listing of references for understanding the complex lipid functions and mechanisms.
Here you will find instructions on how to browse and utilize features of LipidPedia.
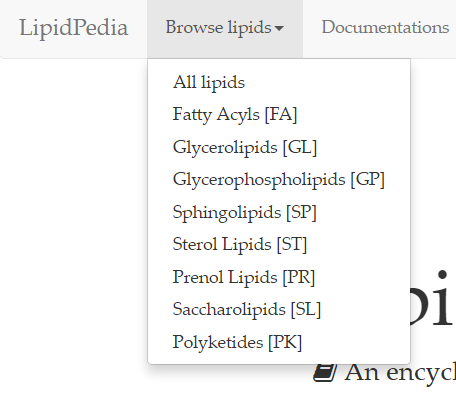
Browse by lipid class
LipidPedia provides a browser interface for lipid classifications of LIPID MAPS.
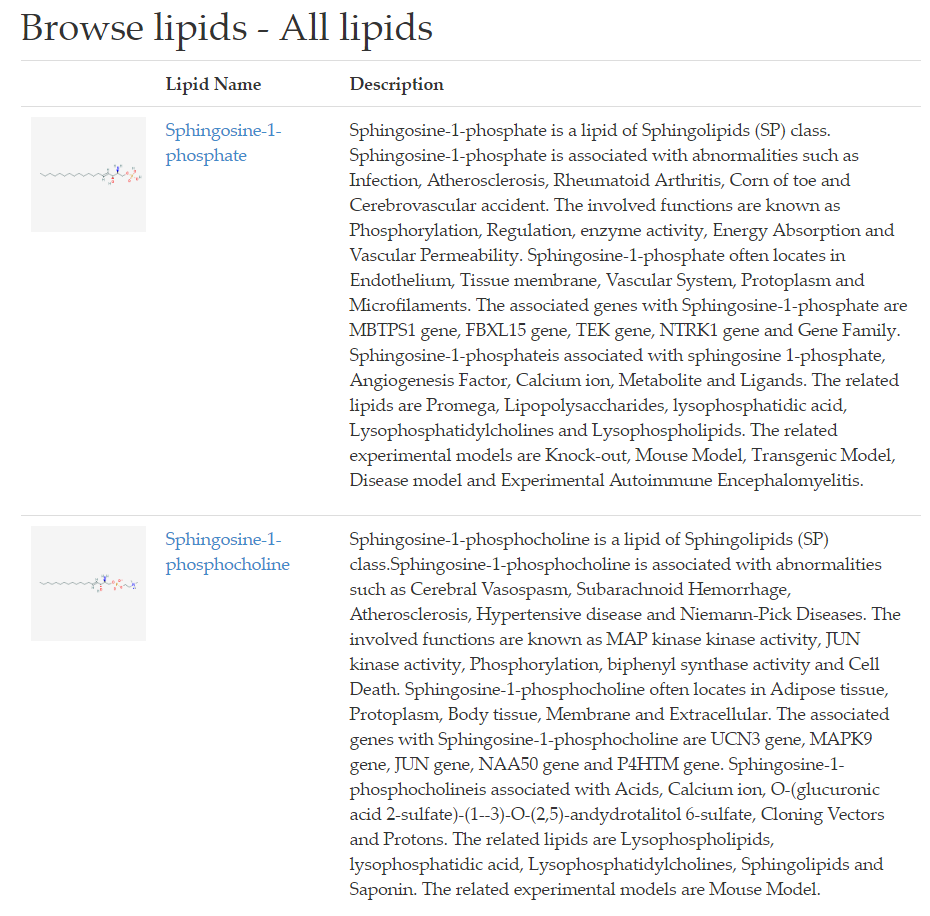
On the next page, results of 'Fatty acyls [FA]' search provides lipid names and their corresponding 2D structures, along with a short description.
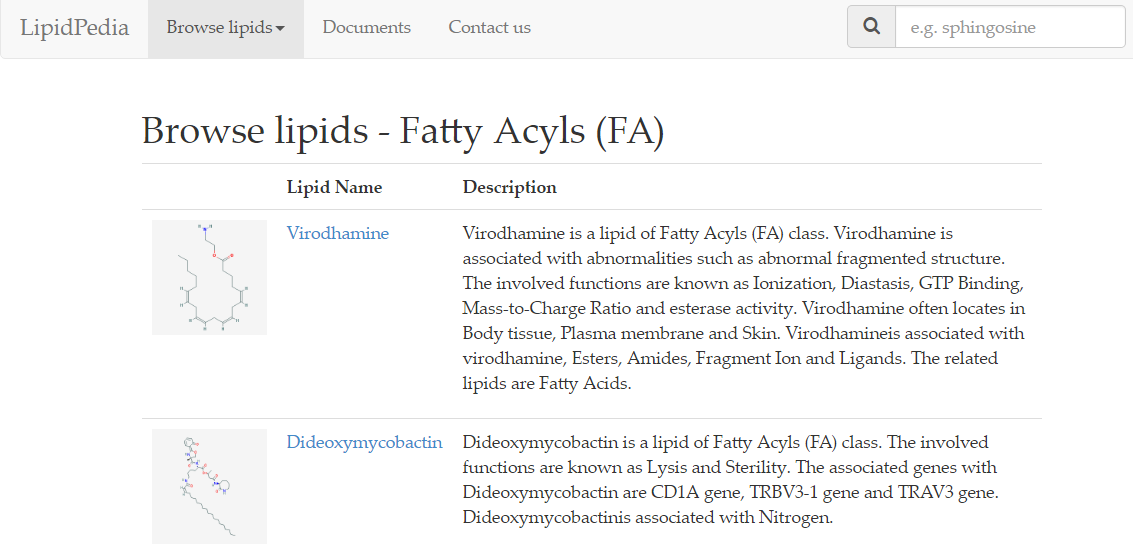
As shown, each row is dedicated to a single lipid. To access the page relating to your lipid of interest, click on the lipid name or the lipid structure.
Search lipid by lipid name or annotations
User can search LipidPedia by entering lipid name or by entering annotation associated with the lipid of interest in the search box on the index (Figure 3) or in the search box on the navigation bar (Figure 4).

When a search term (lipid name or annotation) is submitted, LipidPedia returns search results in the same format (Figure 5).

The search results are displayed in separate rows, with 2D lipid structures, lipid names and their respective annotation summary side by side.
Biomedical sections
General layout for sections
LipidPedia provides specific biomedical information relating to the lipid of interest, including: diseases, pathways, locations, functions, genes/proteins, other related lipids and experimental models. Take disease section as example. The layout of biomedical sections for each lipid of interest includes:
- A disease-specific summary (Figure 6a)
- Statistics of scientific journals with related references (Figure 6b)
- A table consisting references and links to journal articles or other biomedical databases organized by diseases (Figure 6c).
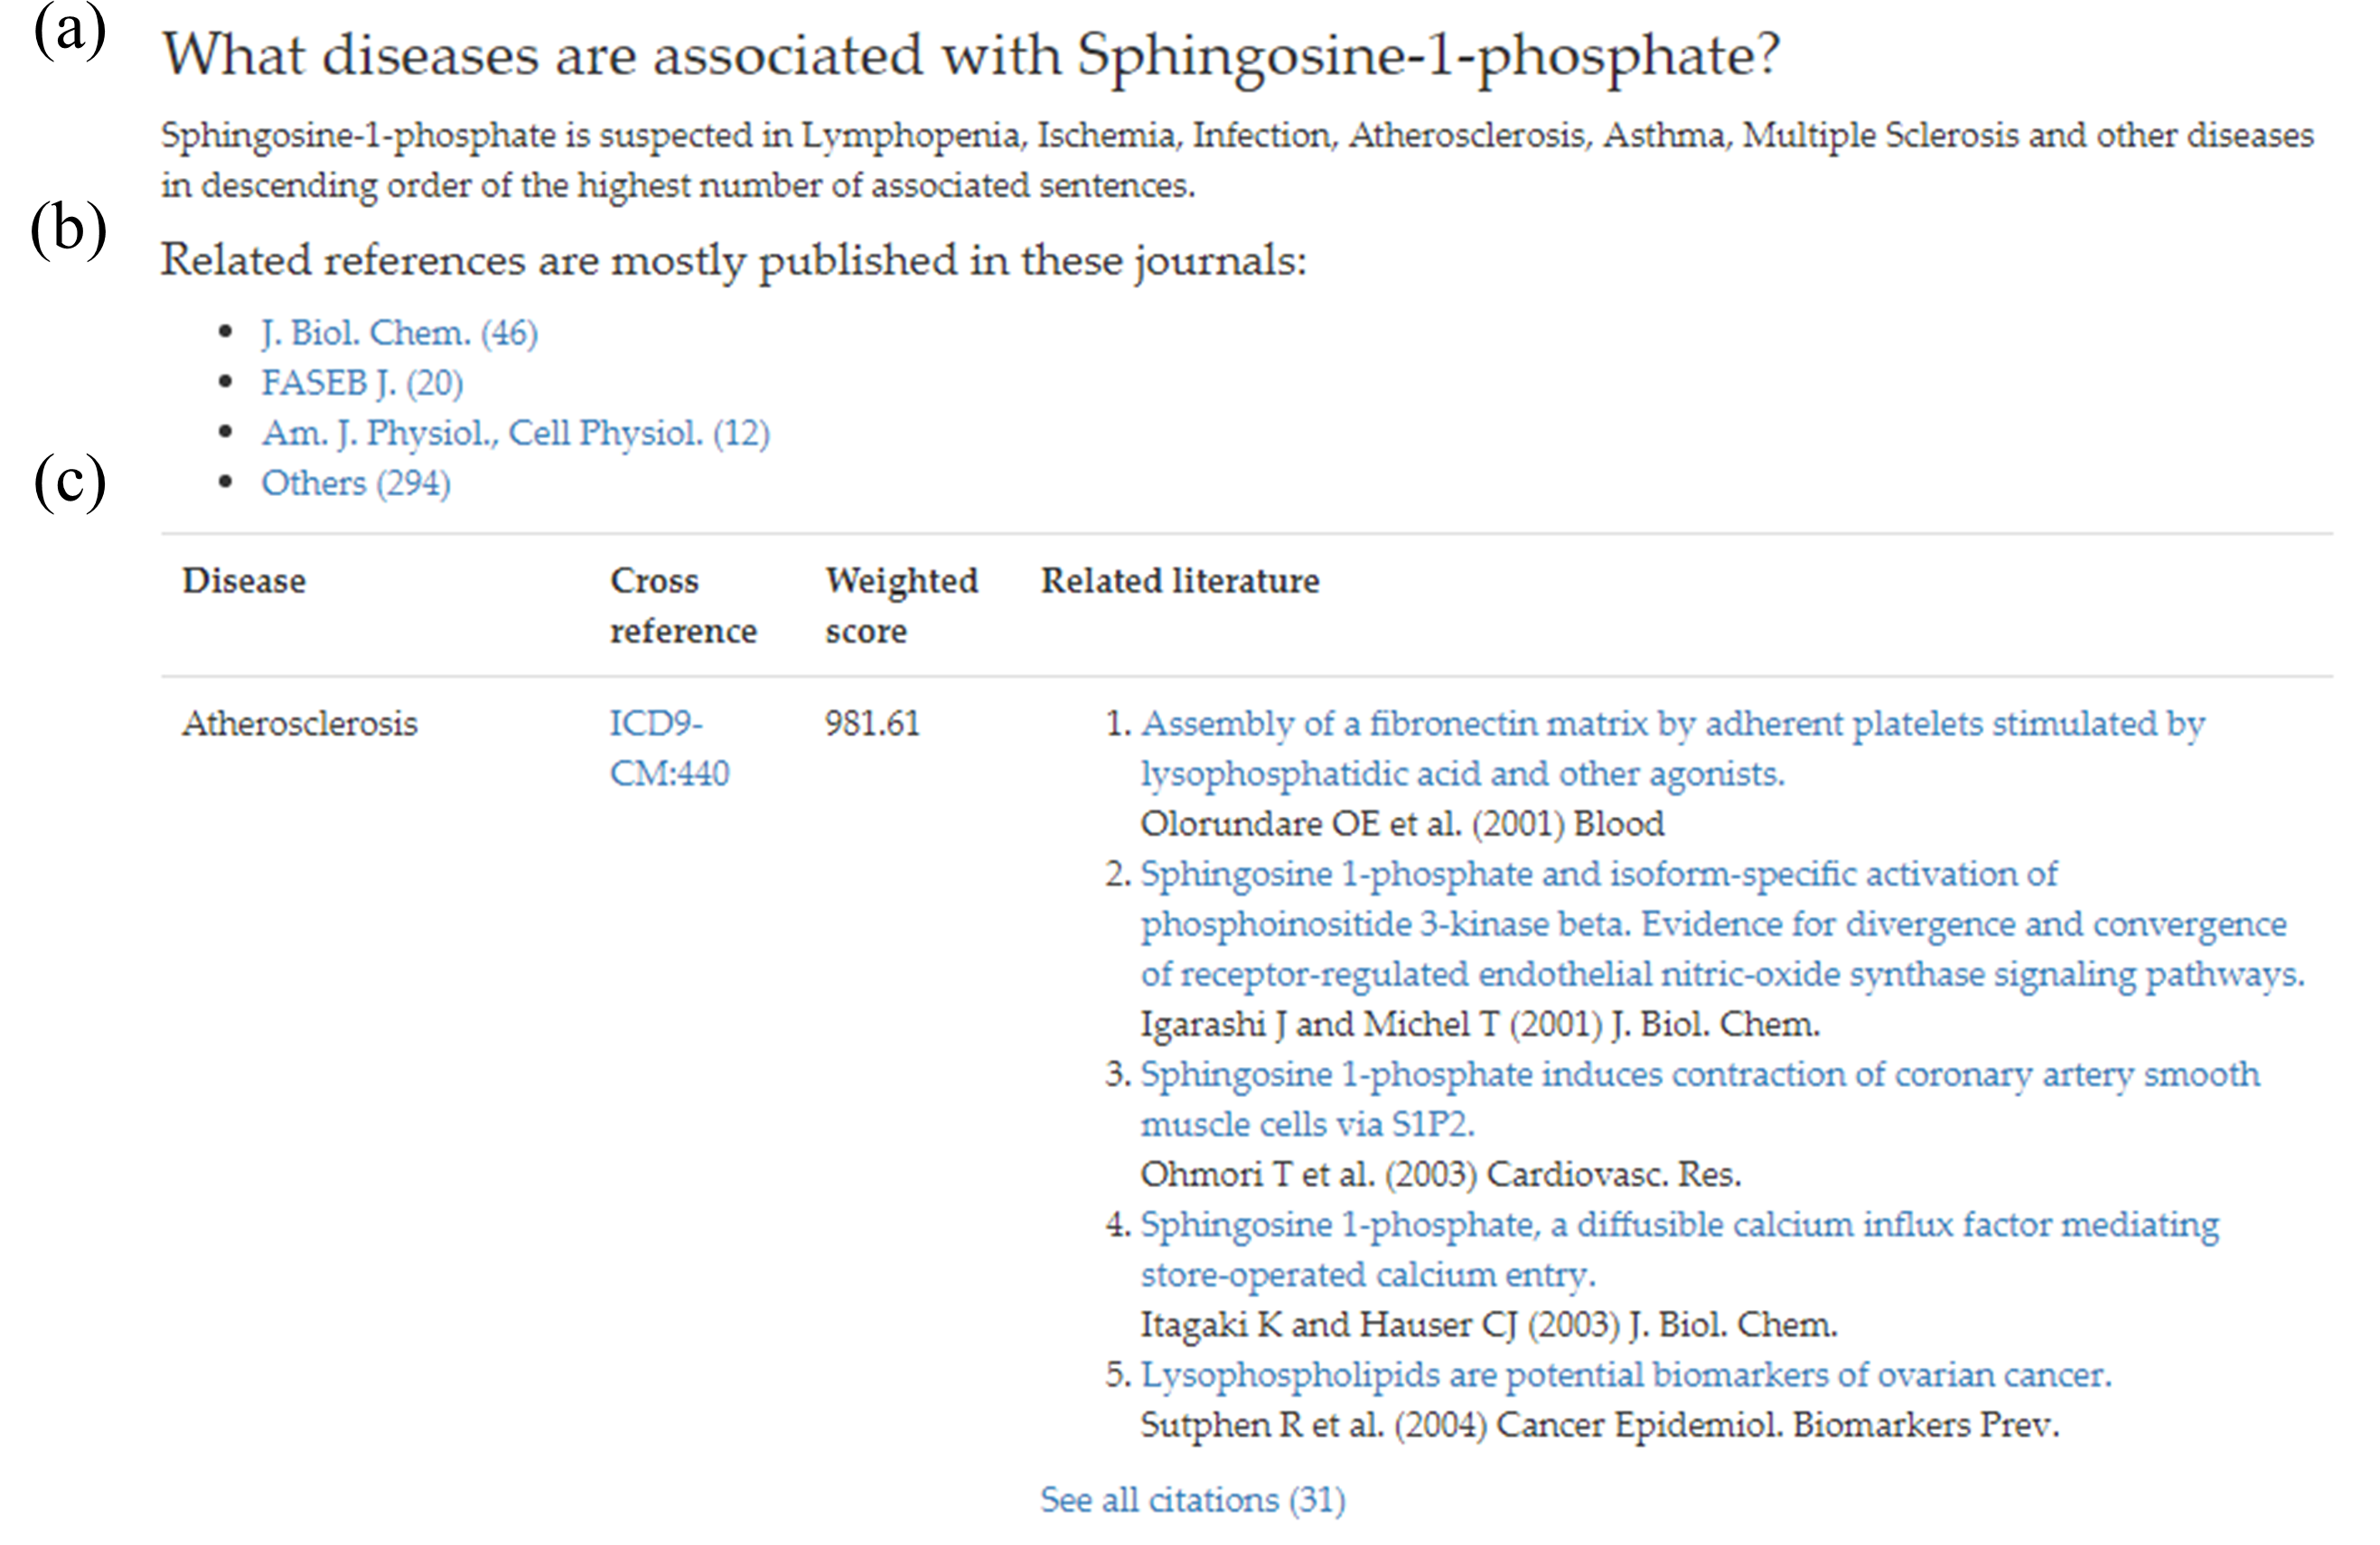
To organize biomedical information for lipid of interest, UMLS concepts (seen as annotations) with higher number of references are displayed on the top of the table in each biomedical section. The cross-reference IDs of annotations are listed to connect users to available resources for further reading. All extracted annotations are organized in a table under separate biomedical sections. The organized table of biomedical annotations (Figure 6d) includes:
- All annotation names (concept names)
- Cross-references/cross-links to external biomedical databases
- Part of the associated citations with hyperlinks to references.
To help researchers identify biomedical annotations (so called UMLS concepts; biomedical concepts defined by UMLS)
Diseases were cross-referenced from International Classification of Diseases (ICD), 9th Revision, Clinical Modification (ICD-9-CM). Locations and functions were cross-linked from the terms of Gene Ontology. ChEBI database. Entrez Gene or UniProt IDs. Experimental models were cross-linked to Medical Subject Heading (MeSH) terms.
Each biomedical information section consists of author names, published dates, and titles of the journal article with mapped concepts. Function concepts were mapped to gene ontology (GO) terms, and processed by REVIGO tool for summarizing various GO terms. Location GO terms were displayed in cellular location visualization. Function GO terms were displayed as word cloud style by R package wordcloud. d3.js.
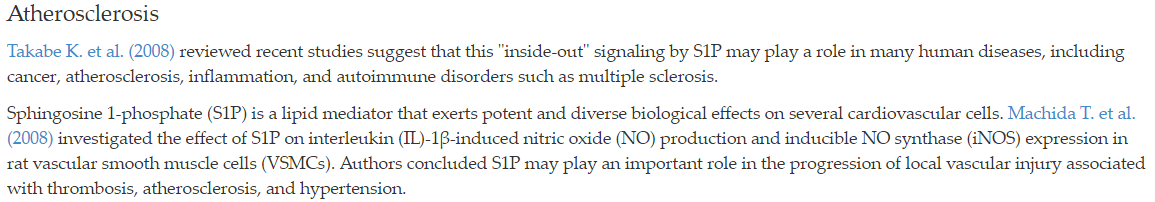
Disease
This section consists of a general text summary with associated disease annotations. Diseases were cross-referenced from ICD-9CM source; cross-referenced IDs are listed in the table.
Take Figure 7 for example, summary of this one particular disease section, aims to provide researchers with the knowledge that S1P is associated with atherosclerosis.
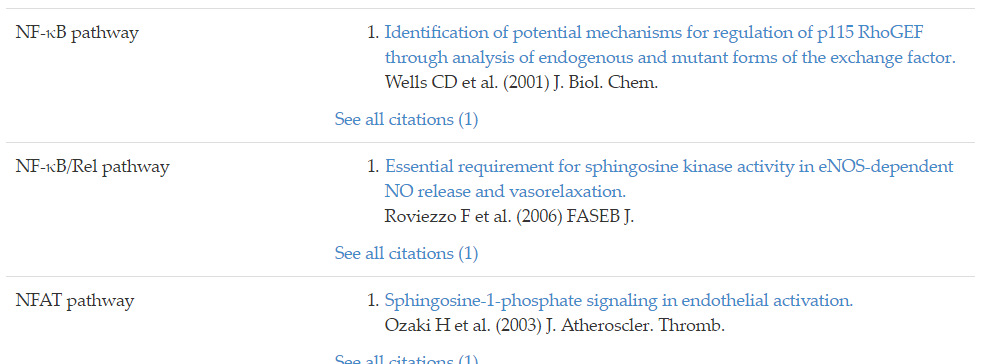
Pathways
Current metabolic pathway databases only specify a few lipid pathways, thus, it is not possible to provide more information if there is no pathway-related concepts to reference from UMLS. As an alternative, searches of 'pathway' from all associated references were included.
Take NF-kappaB pathway for example, this pathway is associated with inflammation as detailed in the table.
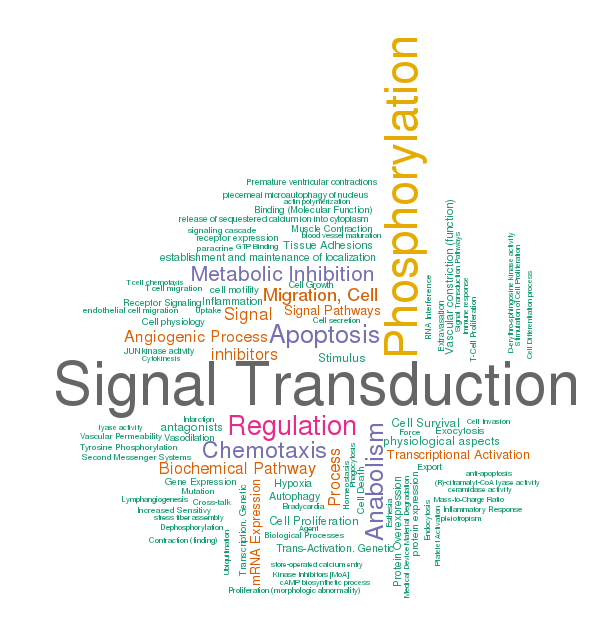
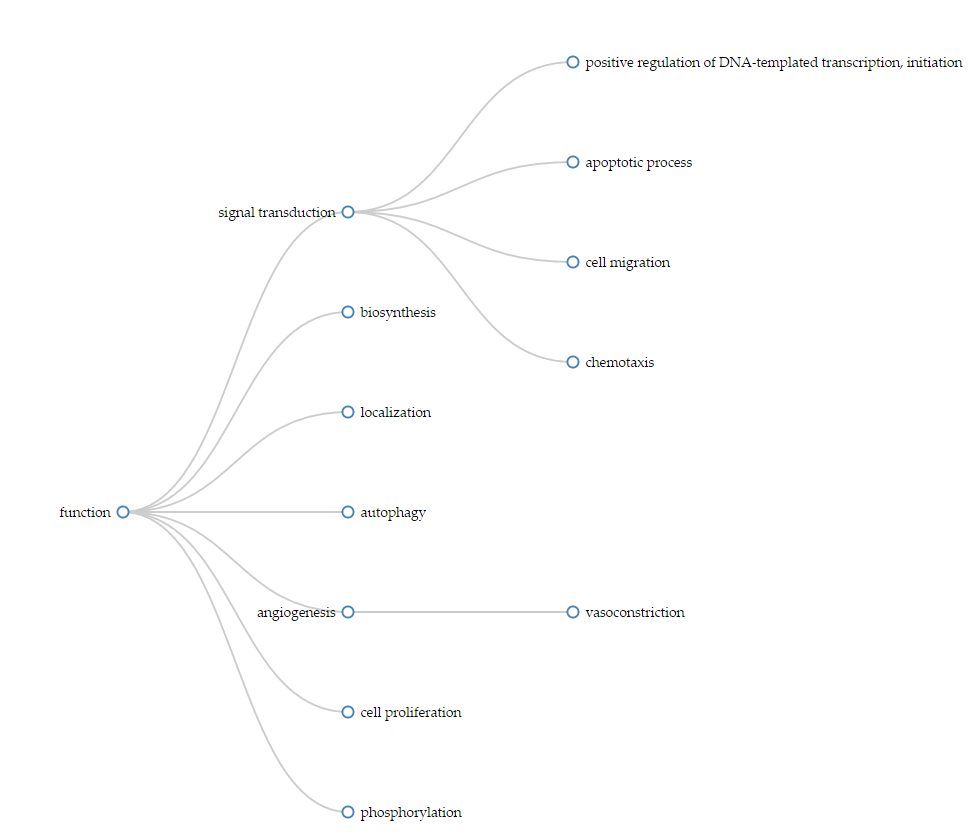
Functions
In addition to the general text summary in this section, a graphic of words is shown to construct a hierarchical view of functions. The word cloud visually depicts the frequency each function shows up in annotations. Larger font size correlates to a more frequently appearing annotations in sentences. The mapped annotations may have cross-reference to GO IDs, and the top 30 GO IDs with the highest number of the related sentences were collected and sent to a web tool REVIGO to remove redundant GO terms and return some summarized figures and list of the slimmed GO terms. With the slimmed GO terms, hierarchical visualization displays the related functions in a hierarchical view.
Here, we used function section of S1P as an example. S1P regulates cell responses through G-protein coupled receptors (S1P1-5) signaling, hence the word ‘phosphorylation’ could be found in word cloud visualization. The world cloud provides a visual emphasis that allows researchers to immediately recognize the main functions or roles S1P plays in signal transduction in just a few seconds (Figure 9)
In addition, LipidPedia also provides a hierarchical visualization to depict the functional hierarchy of Gene Ontology terms. Each circle is associated with a specific function. From hierarchical visualization, researchers could immediately understand S1P signaling may be associated with apoptosis, cell migration or transcription regulation, to name a few.
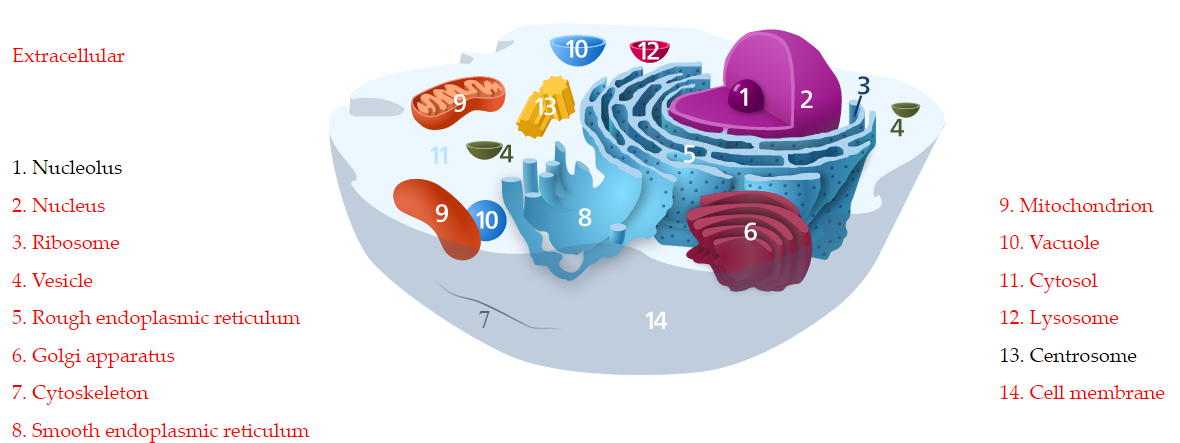
Locations
The most frequently referred to location annotations from literature is depicted in the cellular structure cartoon. The most frequently referred to location annotations from literature was cross-referenced to cellular components in Gene Ontology terms.
The annotations were mapped to GO and visualize locations on cellular structure. The associated locations of S1P were showed in red, and non-associated locations were shown in black. The hyperlinks to GO database is also provided by clicking the subcellular locations on the left or right side of the cellular structure cartoon (Figure 11). From the cellular visualization, researchers could know the locations of S1P in a cell.
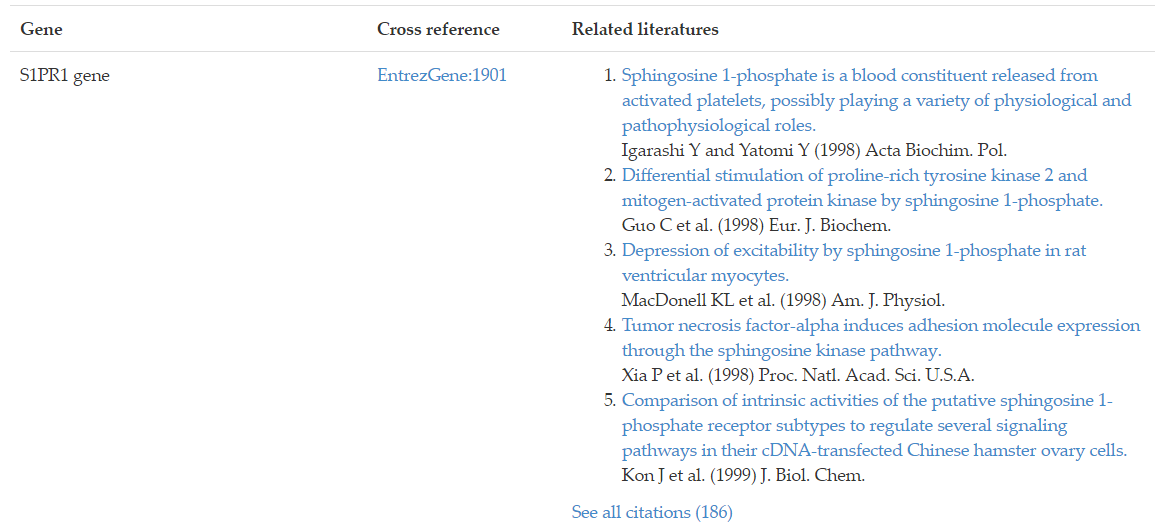
Genes
Genes and gene products associated with the lipid of interest were curated and cross-referenced to Entrez Gene or UniProt database. Associated genes/proteins could be accessed by cross-reference IDs and related references. Take Figure 12 for example, the S1PR1 gene is associated with sphingosine-1-phosphate receptor 1. To access the annotation page of S1PR1 gene in Entrez Gene database, simply click on the cross-reference ID link EntrezGene: 1901.
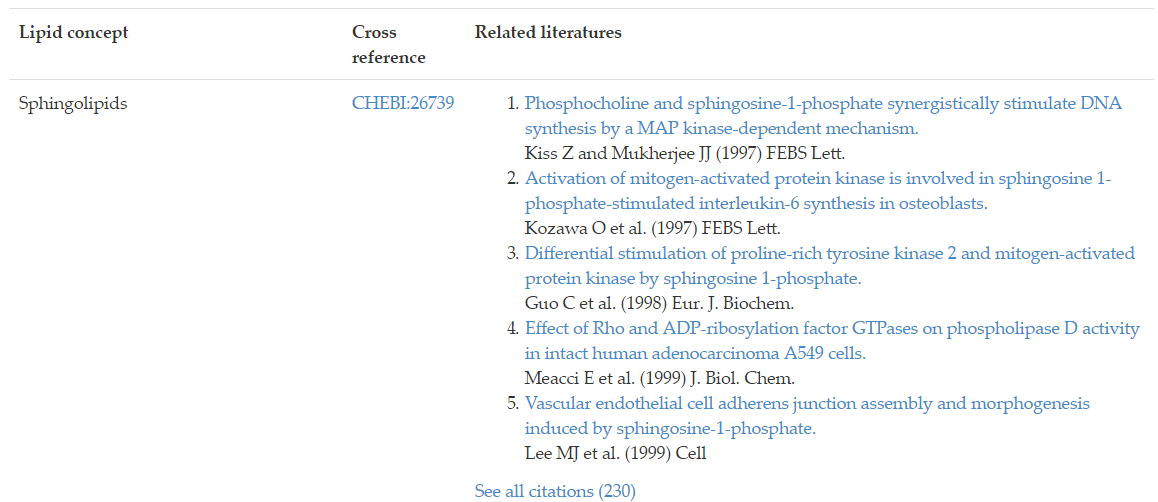
Lipids
Lipids often do not act in solo or independently of other lipids. This section identifies other lipids that are commonly referenced or studied with the lipid of interest. By cross-referencing 230 journal articles and mapping to ChEBI, users can immediately understand that sphingolipid is associated with S1P signaling from Figure 13.
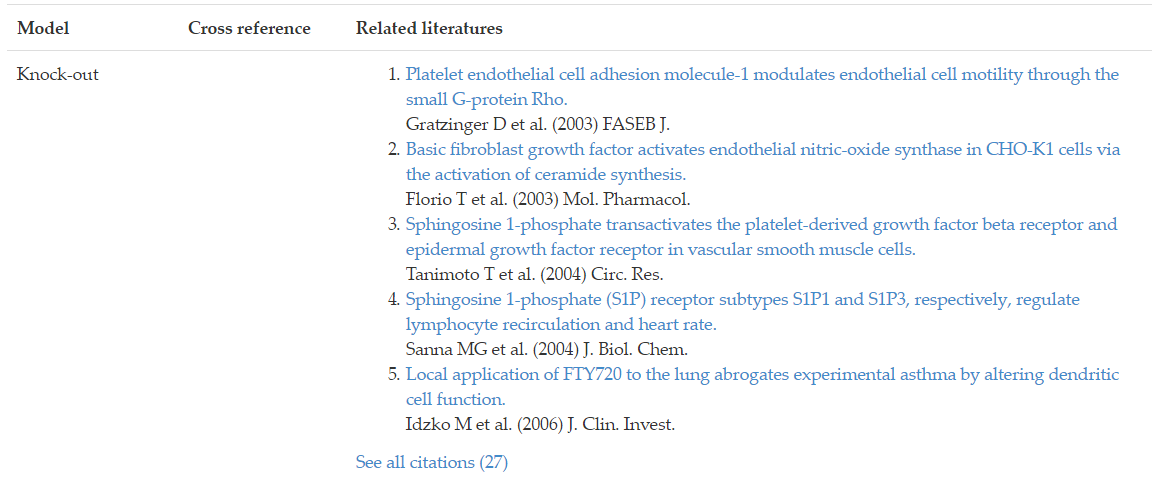
Models
Experimental models for studying the lipid of interest are organized by mapping to MeSH terms, and presented under the ‘Models’ section.